The Hidden Cost of Poor Annotations: How Label Quality Affects Camouflaged Object Detection Performance


ISVC 2025
MY ALT TEXT

Example from the Cotton Bollworm dataset*: comparison between original labels (left) and re-annotated labels using CVAT (right) for camouflaged cotton bollworm detection—note how borders are better defined in the top mask, while two new instances are annotated in the bottom mask.
(*) Meng, K., Xu, K., Cattani, P., Mei, S.: Camouflaged cotton bollworm instance segmentation based on pvt and mask r-cnn. Computers and Electronics in Agriculture 226, 109450 (2024)

Abstract

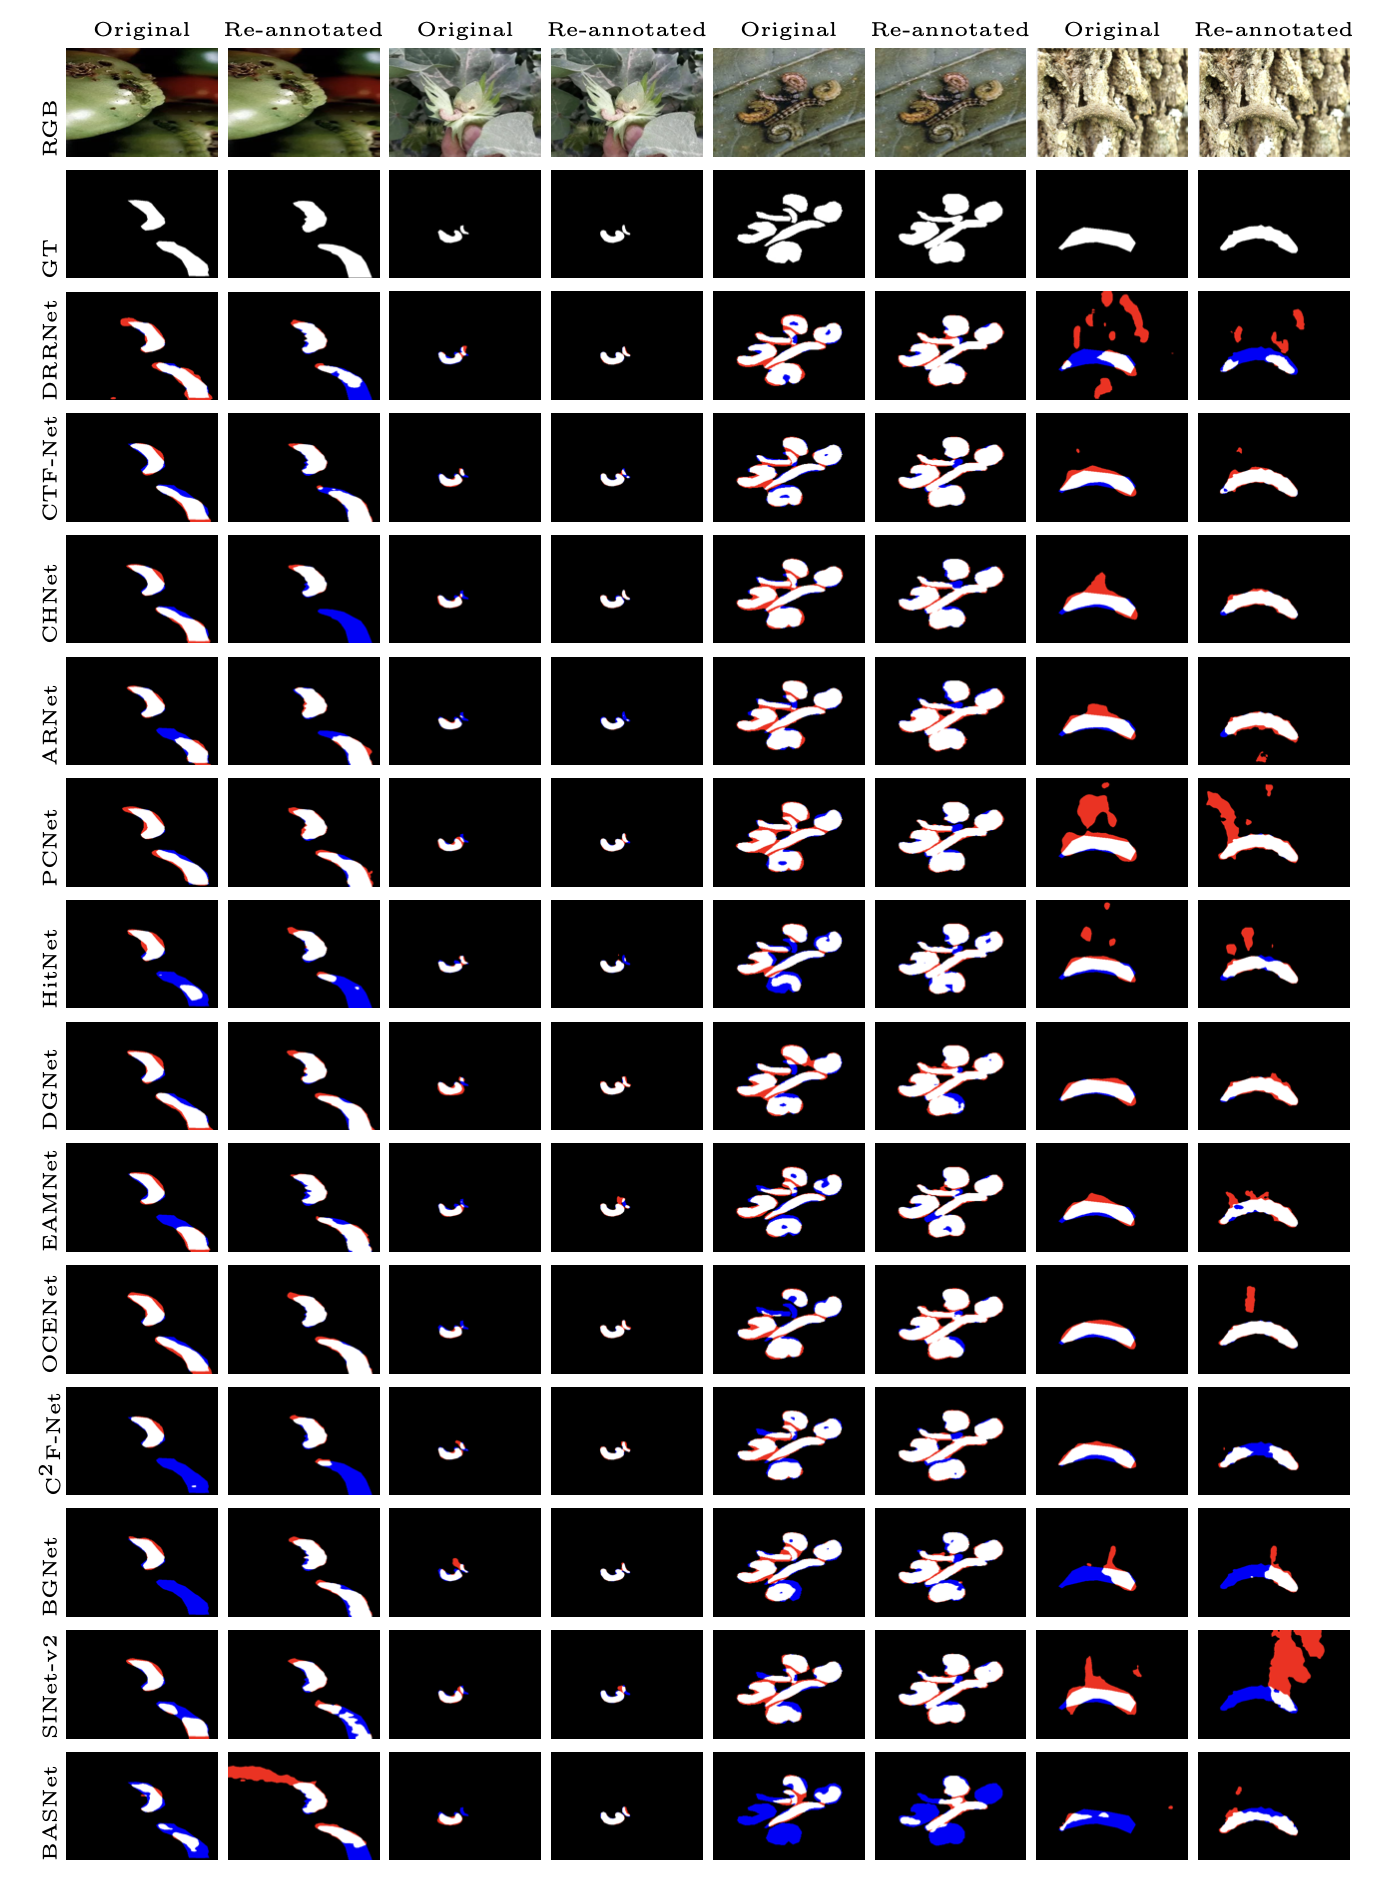
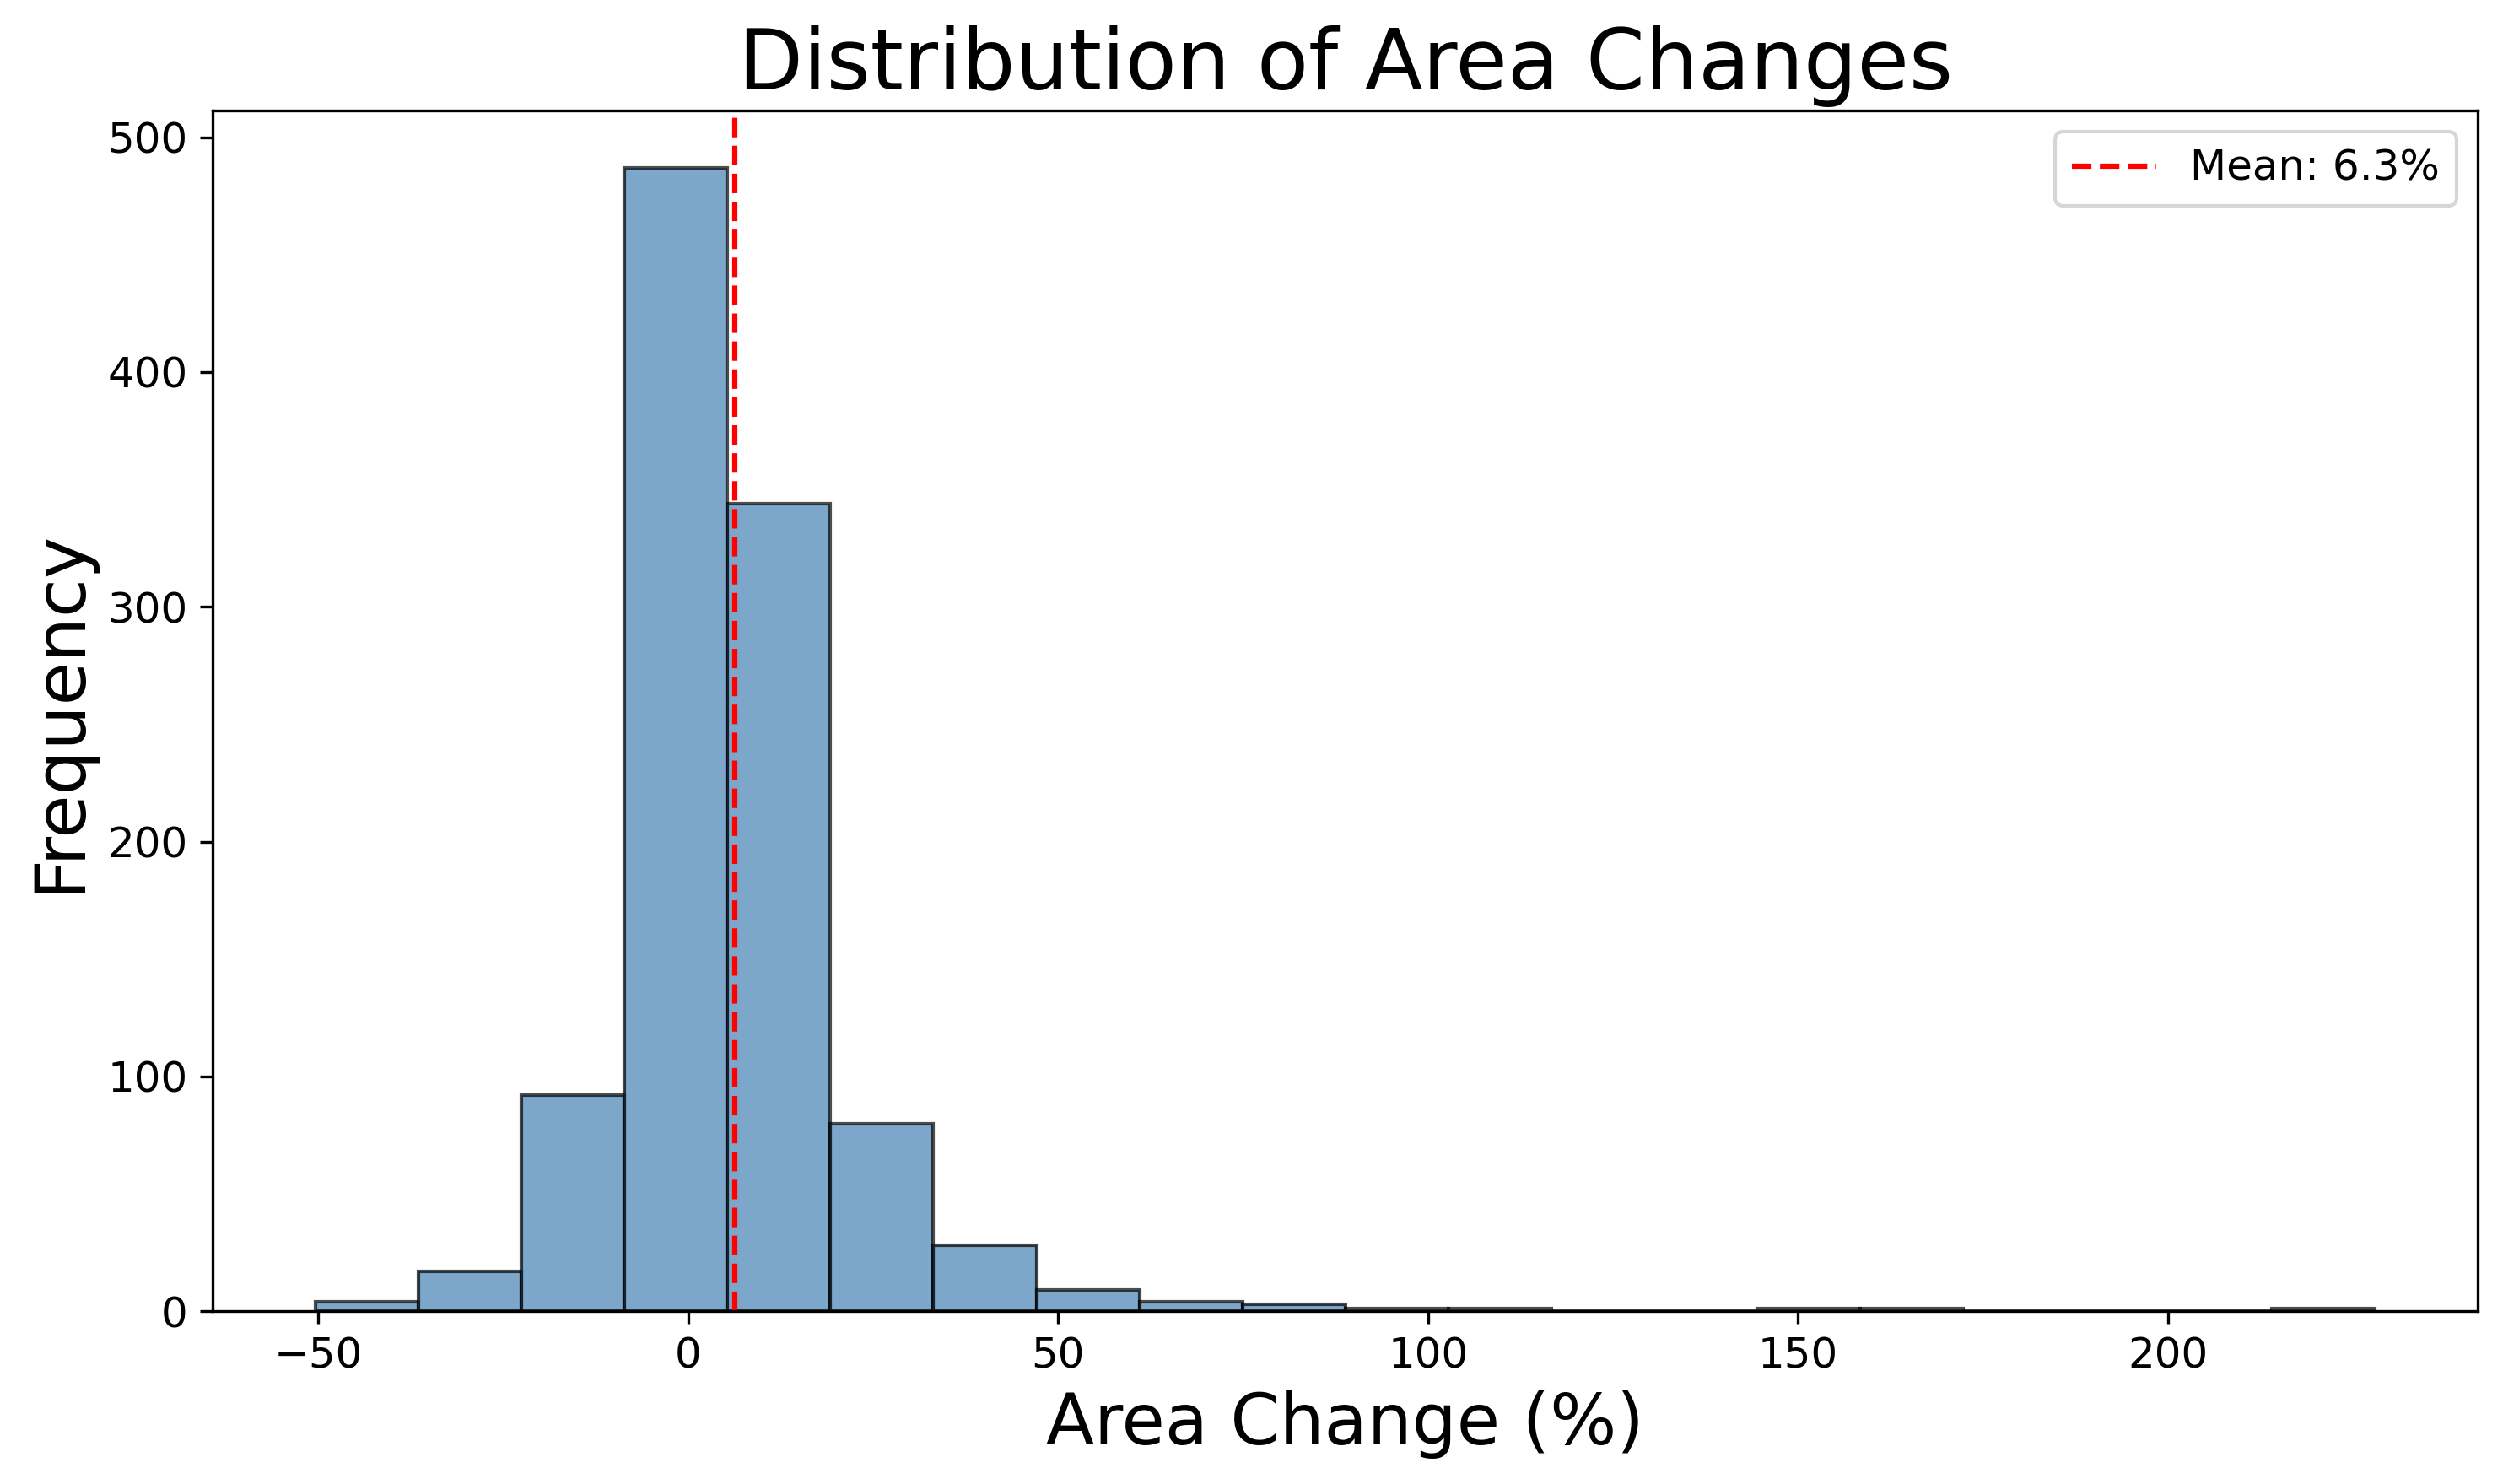
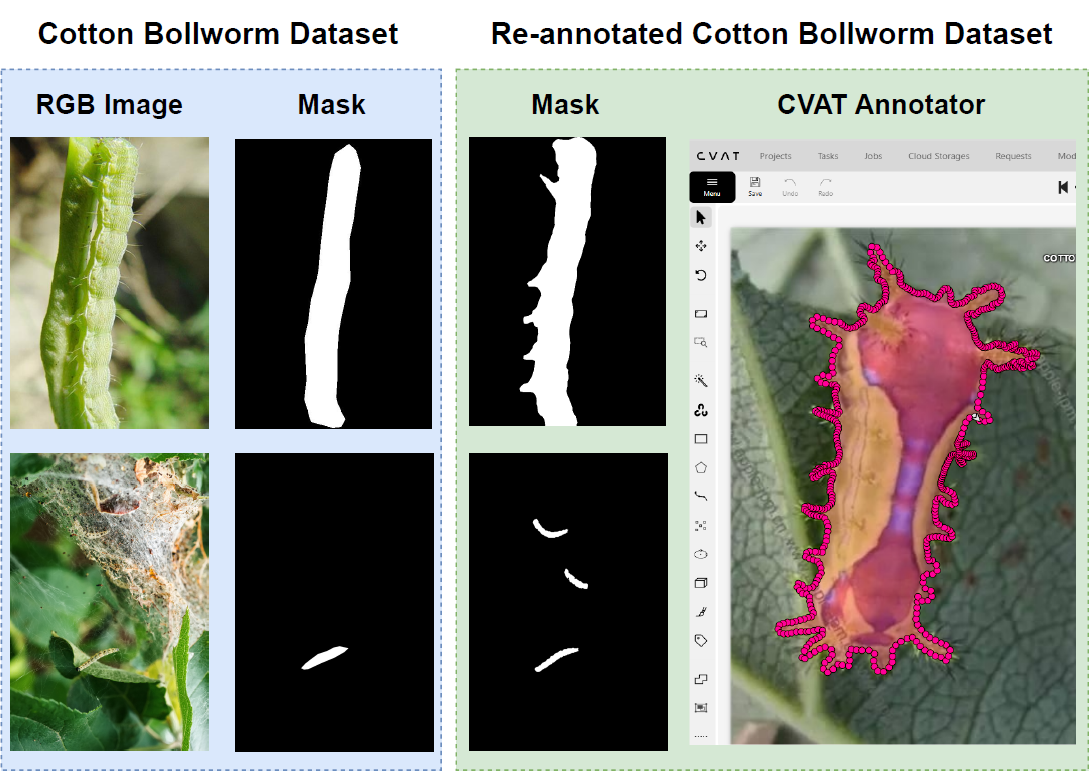
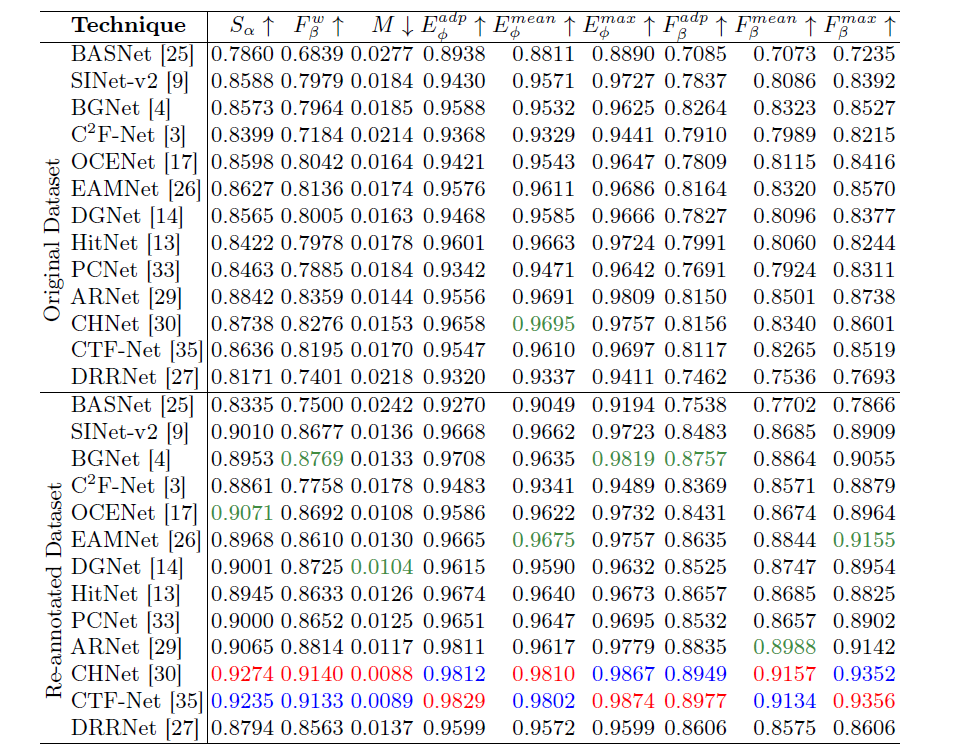
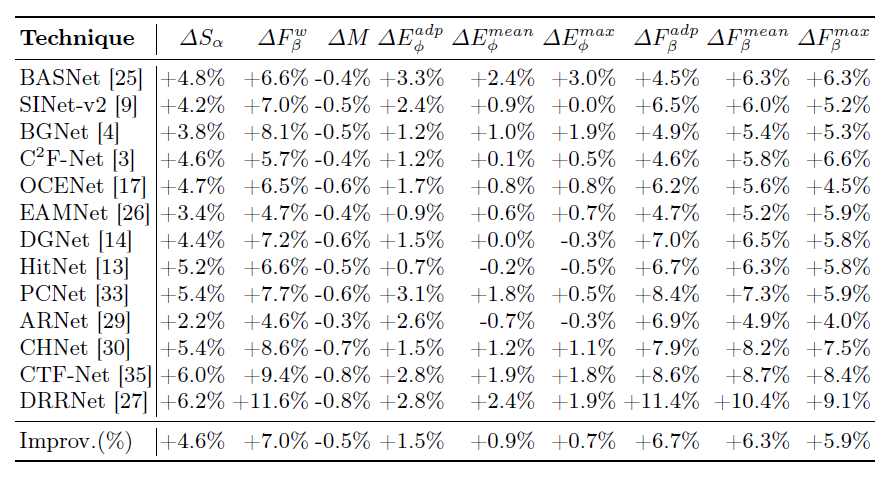
This paper presents an in-depth study on the impact of high-quality, comprehensive annotations on camouflaged object detection (COD) performance. We evaluate 13 state-of-the-art COD models trained on original annotations versus a re-annotated version created under stricter, more consistent guidelines using the Cotton Bollworm dataset. Experimental results demonstrate that enhanced annotation quality significantly improves both Intersection over Union (IoU) scores and instance recall, reducing undetected camouflaged objects by an average of 4.6% in Structure-measure and 7.0% in weighted F-measure. The re-annotation process identified 1.4% additional instances with 6.3% average area refinement, primarily through boundary precision improvements and detection of previously missed instances. These findings underscore the crucial role of precise annotations in advancing COD performance and validate the data-centric AI paradigm, suggesting that systematic annotation refinement should be prioritized in computer vision pipelines. The re-annotated dataset will be made publicly available to support future research.

MY ALT TEXT

Table 1. Distinctive characteristics of the evaluated SOTA COD techniques.

MY ALT TEXT

Table 2. Evaluation metrics for each SOTA COD technique according to the described metrics using original and re-annotated datasets. The best three performing results are highlighted in red (first), blue (second), and green (third) respectively.

MY ALT TEXT

Table 3. Percentage difference between the results obtained for each SOTA COD technique using the original and re-annotated dataset shown in Table 2. Positive values indicate improvement in models using re-annotated labels; negative values indicate a deterioration in performance. The last row shows the improvement (%) results of the training models using re-annotated dataset concerning the original dataset.

Image 1
Image 2
Image 3
Image 4
Image 5
Image 6
Image 7
Image 8
Image 9
Image 10
Image 11
Image 12
Image 13
Image 14
Image 15
Image 16
Image 17
Image 18
Image 19
Image 20
Image 21
Image 22
Image 23
Image 24
Image 25
Image 26
Image 27
Image 28
Image 29
Image 30
Image 31
Image 32

Comparison between the original and re-annotated GT labels. The white areas represent matches between the original and re-annotated GT labels; the orange areas show removed pixels in the re-annotated GT labels; and the green areas show added pixels in the re-annotated GT labels.

MY ALT TEXT

Prediction results of 13 SOTA COD techniques trained with original and re- annotated labels. White areas represent successful matches between GT and predicted masks; red areas denote false positive regions (over-segmentation); and blue areas in- dicate false negative regions (miss-segmentation).

Paper